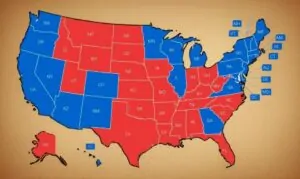
The US political map red and blue is a visual cornerstone of American electoral discourse. It simplifies complex election results into an easily digestible format, symbolizing the dominant political affiliations across states. This iconic representation, featuring red for Republican-leaning areas and blue for Democratic-leaning regions, helps observers quickly grasp nationwide political trends and regional divides. Understanding this map is crucial for anyone interested in US elections, policy discussions, and the broader political landscape. It highlights battleground states, shifting demographics, and the enduring ideological differences that shape the nation. Exploring the nuances beyond the colors reveals deeper insights into voter behavior and electoral strategies across the United States. This tool remains vital for forecasting and analyzing electoral outcomes, making it a continuously trending topic.
The US political map red and blue is a powerful visual tool. It quickly communicates the political leanings across the United States. This map simplifies complex electoral data, showing which states favor Republican (red) or Democratic (blue) parties. It has become an essential part of American political discussions and media coverage. Understanding this map helps explain election outcomes and voter sentiment nationwide. Political analysts use it to identify trends and forecast future elections, keeping it relevant and highly discussed.
Understanding the US Political Map Red and Blue: A Visual Guide
Historically, the designation of red for Republicans and blue for Democrats solidified around the 2000 presidential election. Before this, there was no consistent color scheme; media outlets often varied their choices. However, the vivid imagery from that election cemented red for Republicans and blue for Democrats in public consciousness. This color coding provides a clear, immediate understanding of the prevailing political alignment in each state, impacting how we perceive national unity and division.
The Evolution of the US Political Map Red and Blue: From Fluidity to Fixed Meanings
Initially, media outlets used different colors, sometimes even reversing the red and blue assignments. The consistency we see today evolved over time, driven by major news networks seeking a standardized visual representation. This standardization transformed a simple mapping convention into a powerful symbol of American political identity. It now serves as an instant indicator of state-level political leanings for citizens and commentators alike.
Why Does the US Political Map Red and Blue Matter? Impact on Elections
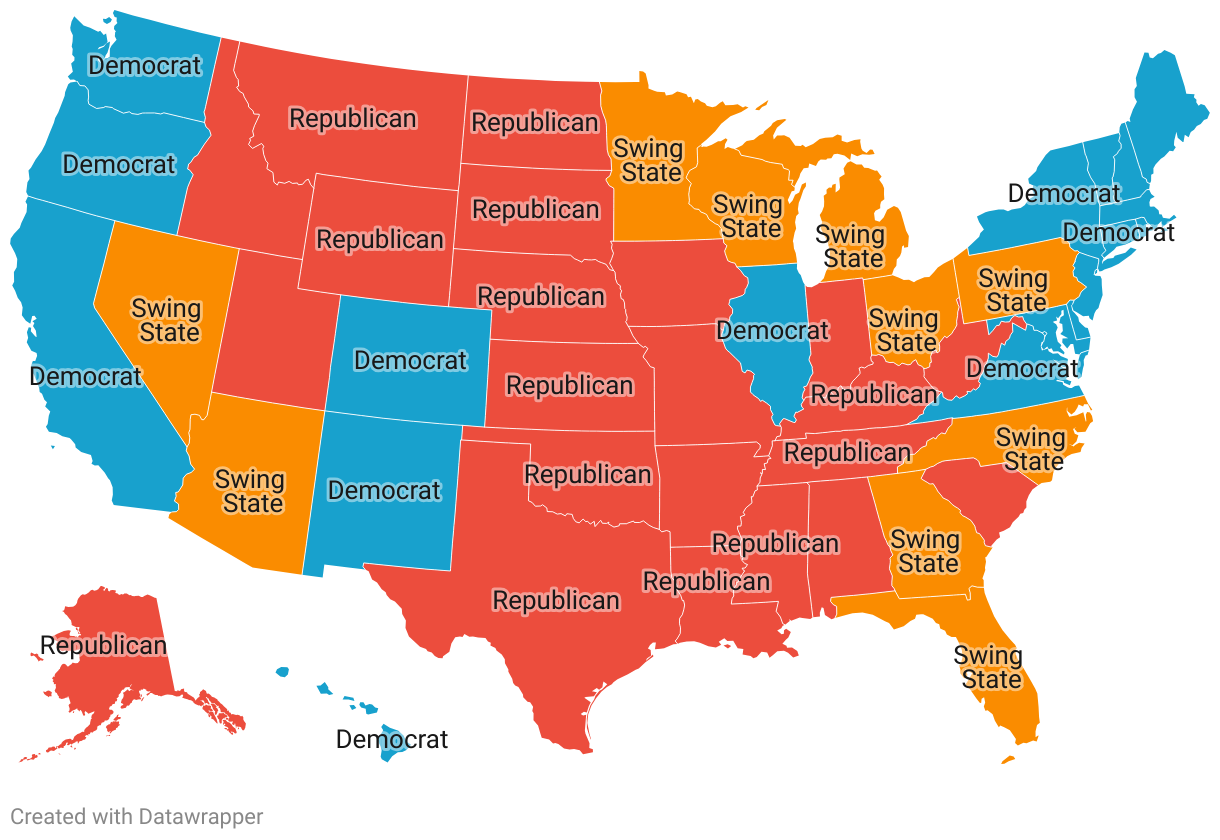
This visual division is more than just colors on a map; it reflects fundamental differences in policy preferences and cultural values. The us political map red and blue influences campaign strategies, media narratives, and public perception of national unity. It helps explain where political parties focus their resources. It also highlights the critical swing states that can determine election outcomes, making the map a dynamic representation of political power.
Analyzing Trends in the US Political Map Red and Blue: What 2026 Reveals
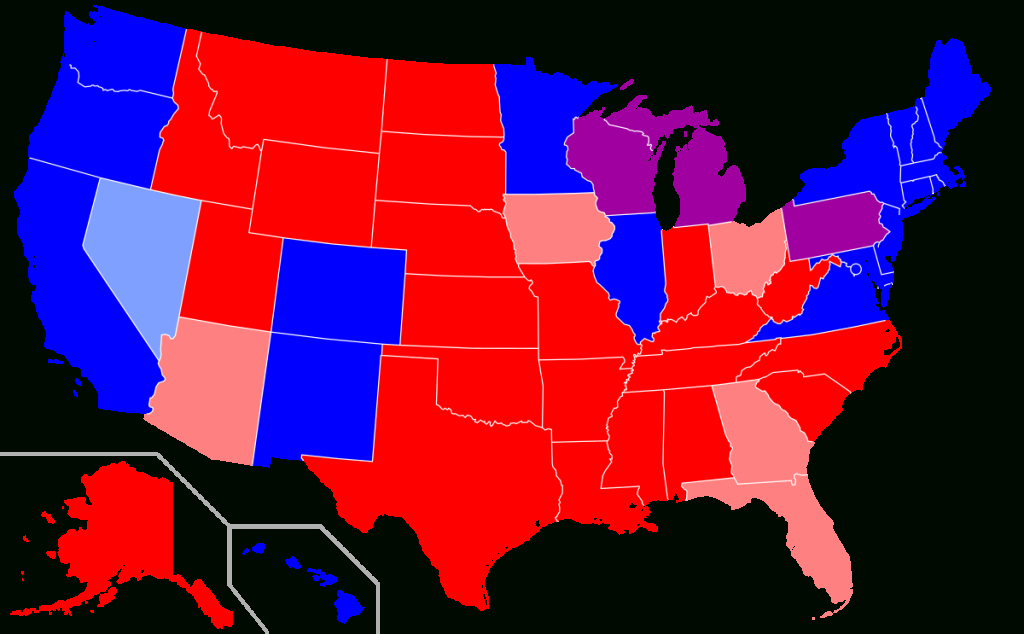
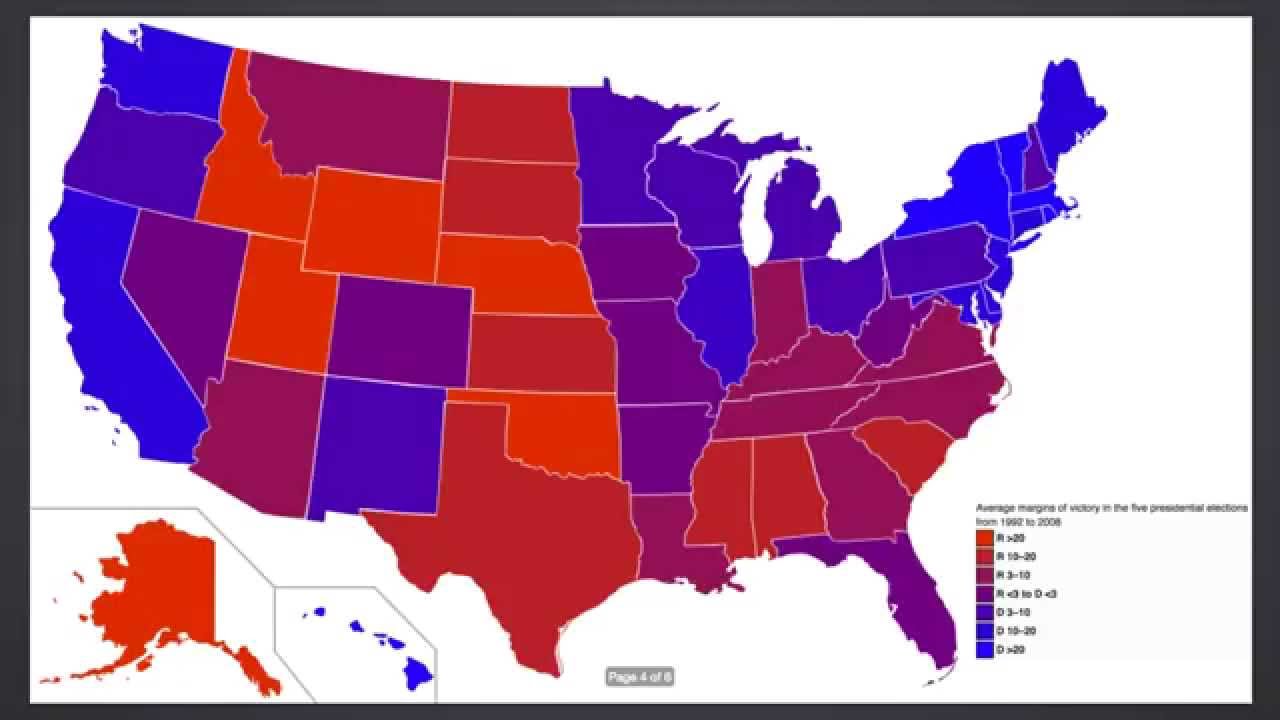
As of 2026, the US political map red and blue continues to show persistent regional patterns, though some states exhibit increasing purple tendencies, indicating competitive races. Urban areas typically lean blue, while rural regions often lean red. Suburban areas remain key battlegrounds, with their political affiliations shifting based on evolving demographics and current issues. These ongoing shifts ensure the map remains a fascinating and vital topic for political observers.
| Color | Political Party | General Ideology | Common Geographic Areas |
|---|---|---|---|
| Red | Republican Party | Conservative | Rural areas, Southern states, Mountain West |
| Blue | Democratic Party | Liberal/Progressive | Urban centers, Coastal regions, Northeastern states |
| Purple | Competitive/Swing | Mixed/Varies | Suburban areas, historically contested states |
What Others Are Asking?
What do red and blue states mean on the US political map?
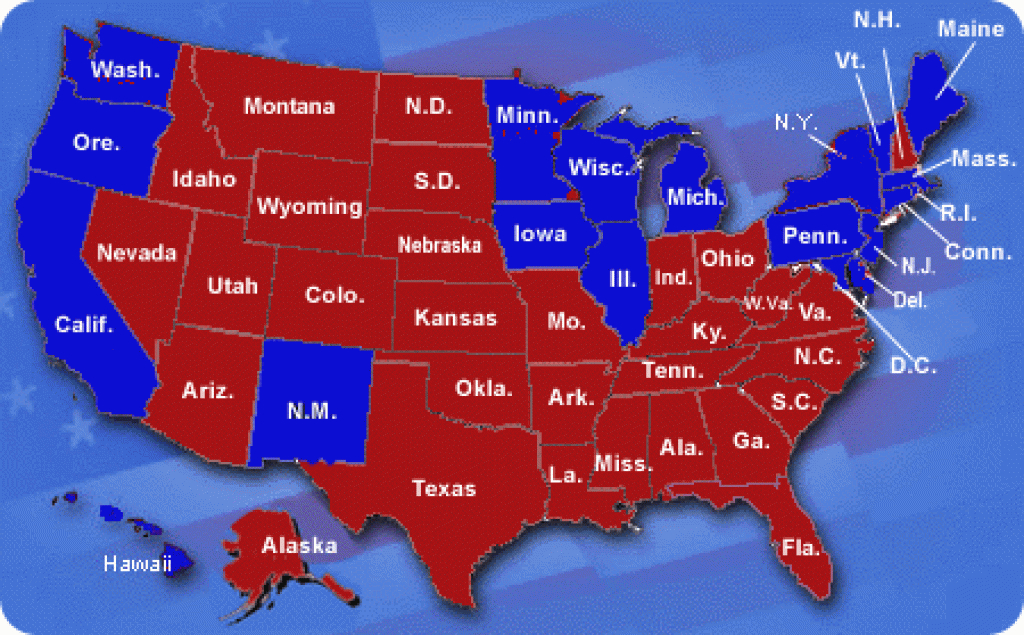
Red states on the US political map typically indicate states where the Republican Party consistently wins presidential elections or holds a majority in state-wide offices. Blue states represent areas where the Democratic Party predominantly secures victories. These colors simplify the complex political leanings of each state, offering a quick visual cue to national electoral trends.
Why are Republicans red and Democrats blue on the map?
The assignment of red to Republicans and blue to Democrats on the US political map largely solidified during the 2000 presidential election coverage. News organizations, seeking a consistent visual language for election night results, adopted these colors, which then became widely accepted. Before 2000, color assignments varied greatly among media outlets.
Are there more red or blue states in the US?
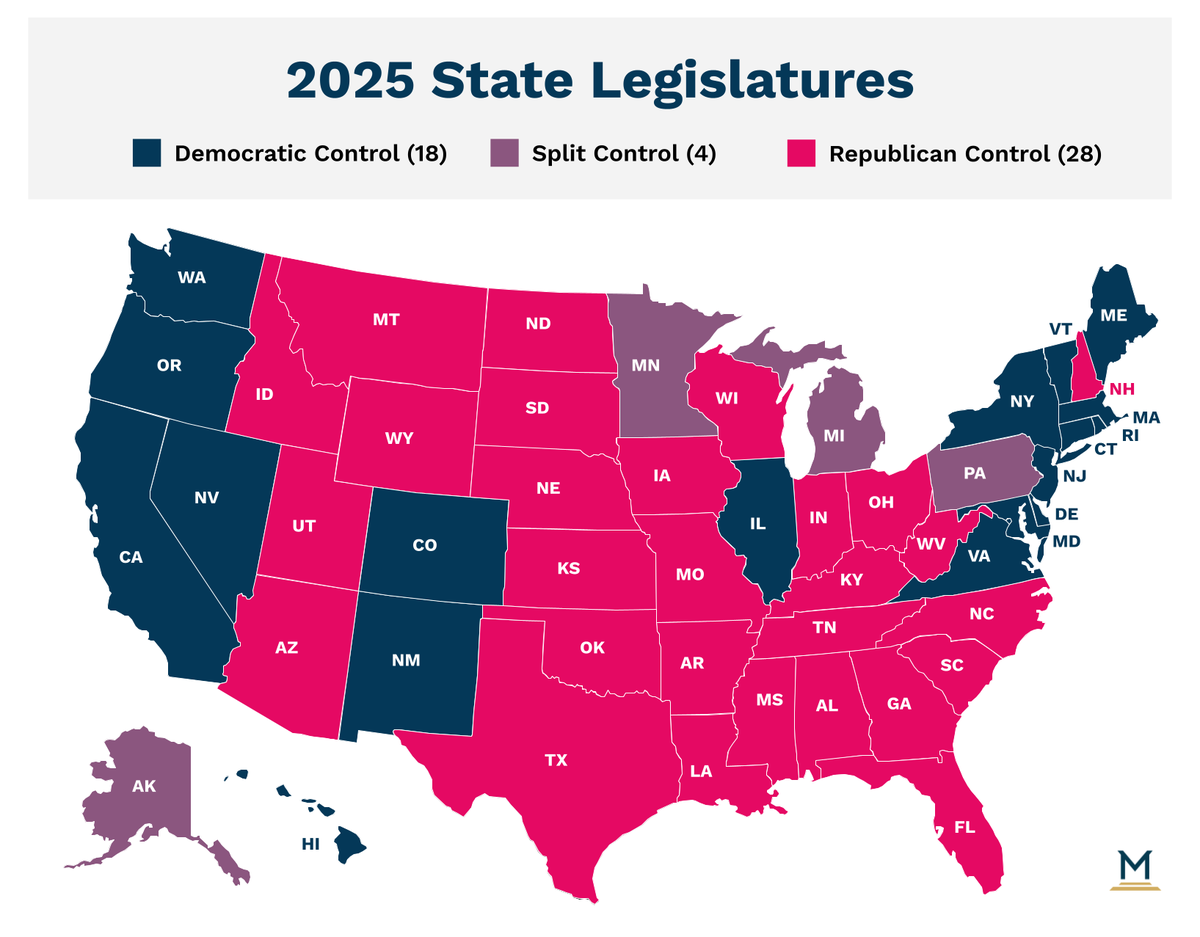
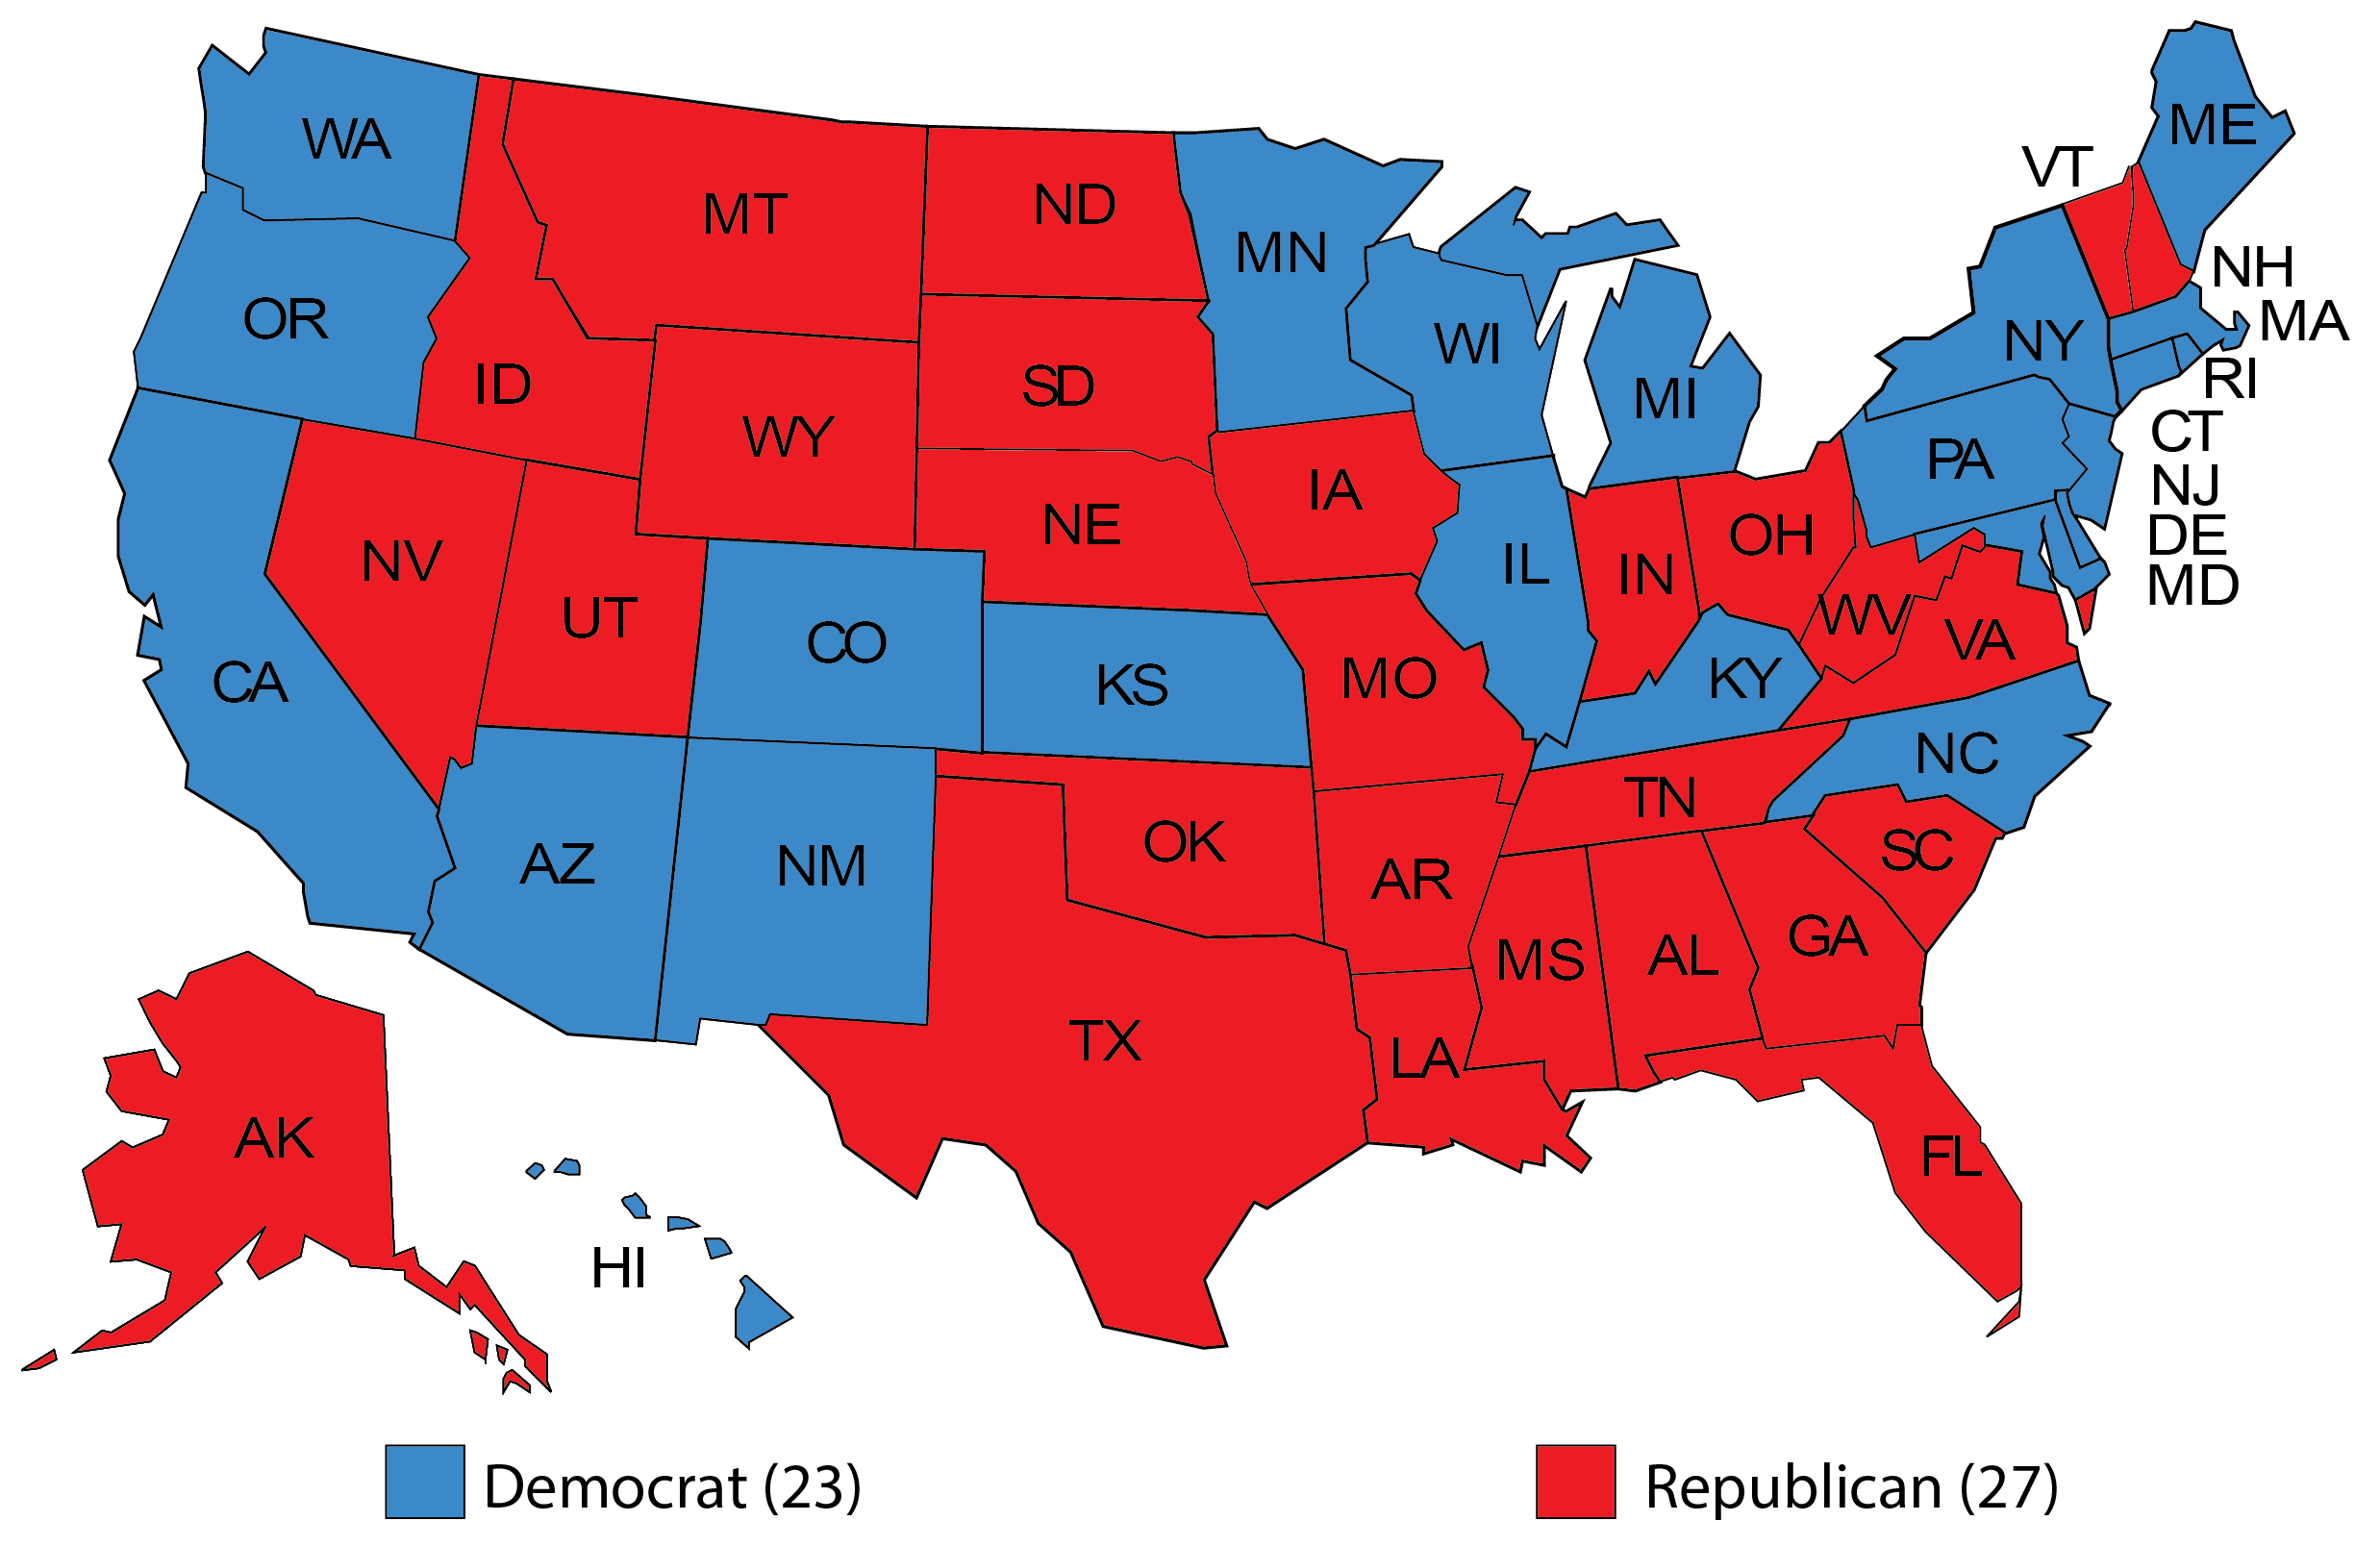
The number of red or blue states can fluctuate depending on the specific election and the criteria used (e.g., presidential, gubernatorial, or legislative control). Generally, there are more states that reliably vote one way or the other, creating a relatively stable balance. However, the electoral college impact means a few swing states often decide national outcomes.
What is a swing state on the US political map?
A swing state, often depicted as 'purple' or fluctuating between red and blue on the US political map, is a state where electoral outcomes are not consistently predictable for either major party. These states have a significant number of undecided voters or a relatively even split between Republican and Democratic support, making them crucial targets for campaigns.
How does the US political map red and blue impact election strategy?
The US political map red and blue profoundly impacts election strategy by directing where campaigns focus their resources. Parties often concentrate efforts on swing states, as solid red or blue states are generally considered safe. This strategic allocation of time, money, and candidate visits aims to persuade undecided voters and mobilize party bases in competitive areas.
FAQ about the US Political Map Red and Blue
Who uses the US political map red and blue?
Voters, political analysts, media outlets, and campaign strategists widely use the US political map red and blue. It helps them understand election results and political trends.
What does the US political map red and blue represent?
It represents the general political leaning of each US state, with red signifying Republican majority support and blue indicating Democratic majority support, particularly in presidential elections.
Why is the US political map red and blue important?
It is important because it provides a clear, immediate visual summary of national political divisions and helps identify crucial swing states, which significantly influence election outcomes.
How did the colors red and blue become associated with parties?
The association of red with Republicans and blue with Democrats solidified around the 2000 US presidential election. Media consistently used these colors for clarity, and the public quickly adopted the convention.
How do political boundaries on the US political map red and blue change?
The boundaries on the US political map red and blue don't physically change, but the color of a state can shift over time based on electoral results, demographic changes, and evolving voter preferences.
Audience Profile for US Political Map Discussions
Height: Variable Build: Any Hair: Any Eyes: Any Age Range: 18-99 Ethnicity: All
Key Takeaways on the US Political Map Red and Blue
The US political map red and blue remains a crucial tool for understanding American politics. It simplifies complex data into an accessible format. While the colors are symbolic, they highlight real electoral divisions and campaign battlegrounds. Continuous analysis of this map is vital for informed civic engagement. It shows how states contribute to the national political narrative.
The US political map red and blue visually represents electoral outcomes and political leanings. Red signifies Republican strongholds, while blue indicates Democratic dominance. This map highlights regional political divides and the concept of swing states. It is essential for understanding US elections and voter behavior. The color coding simplifies complex political data for broad comprehension.
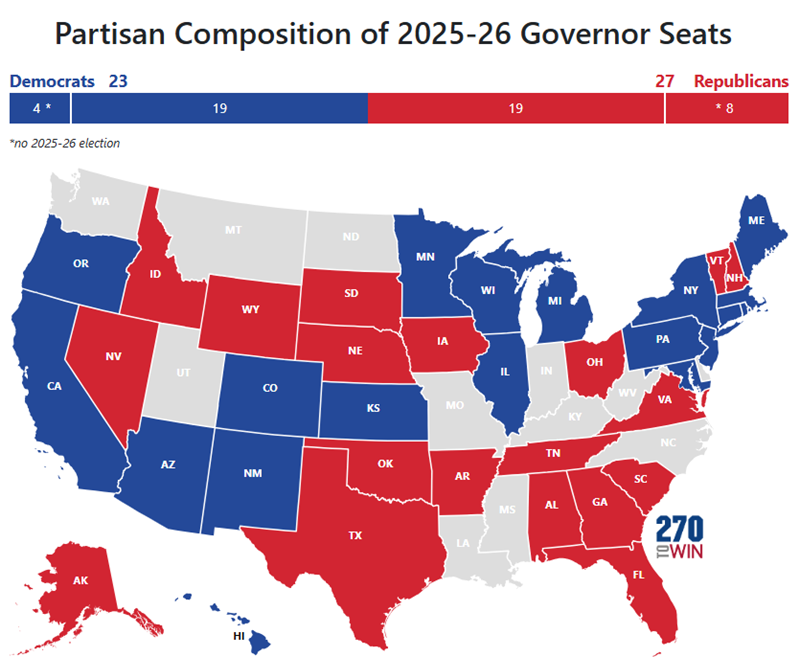
Introducing The 2026 House Interactive Map 270toWin 2026 Election Incumbent Party Red And Blue Map 2016 The New York Times 2016mapLN Master768 When Are The 2026 Elections
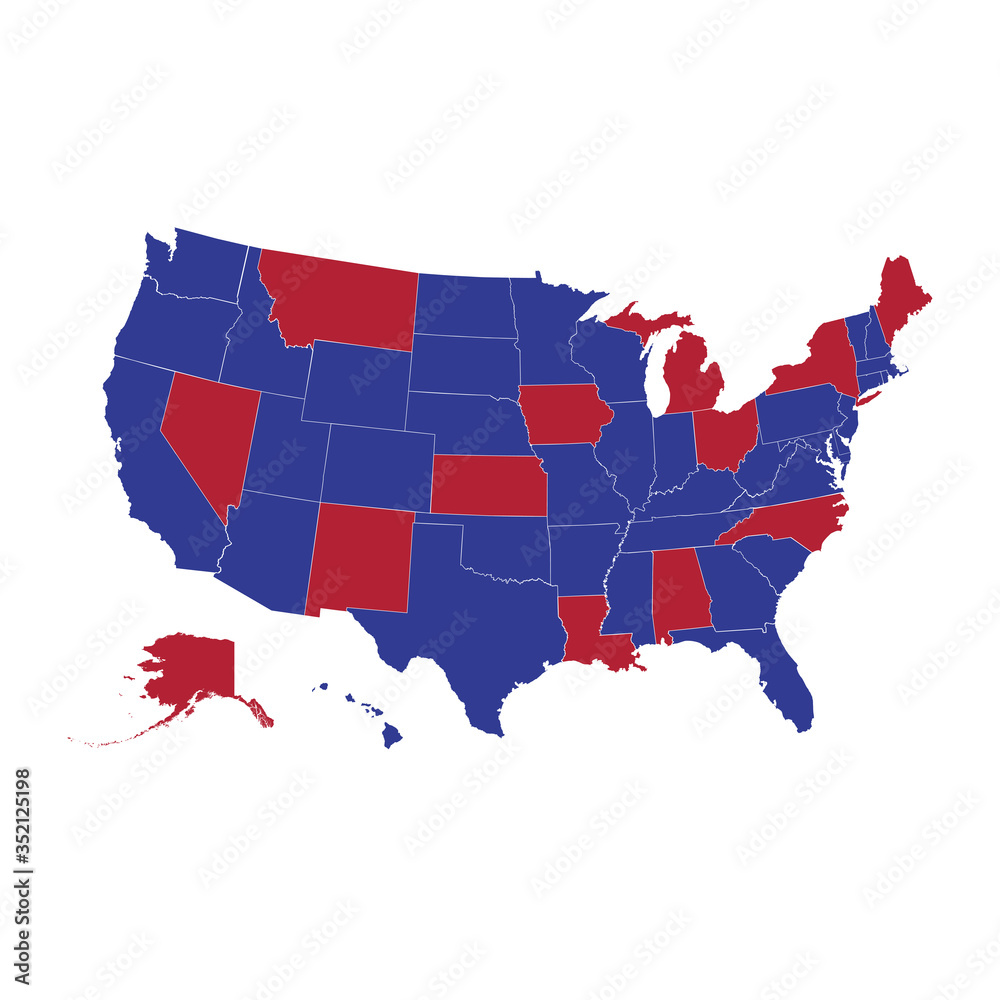
Map Of USA Red And Blue States Dateired States And Blue States Of The Us Based On Data From The In Map Of Usa Red And Blue States 2026 Senate Sabato S Crystal Ball 2025 06 03 SenateMap Red Vs Blue The US Political Map 1000 F 352125198 Red And Blue States 2024 Full
Republican Blue Colors Up 1964map Fact Check Map Showing Trump S 2024 Reelection Victory With Red AndPrediction Markets And Polls Ten Competitive Senate Primaries In 2026 2024 Actual USA Map Of Red And Blue States 2025 Red States And Blue States Wikipedia Inside Usa Map Of Red And Blue States 2025
New Interactive Map 2025 2026 Elections 270toWin Governor 2025 26 Incumbent Red Vs Blue States And The Shifting US Political Map In 2025 North Geographic Overview Red Vs. Blue State Leadership Red States Blue States Us Political Map Red Blue Sldl.svg
Usa Map In Red And Blue Color Stock Download Image Now Usa Map In Red And Blue Color Usa Map Political Map Red And Blue Png Transparent United States Road Map Red States And Blue States United States World United States Road Map Politics Of The United States Red States And Blue States Political Png Transparent Politics Of The United States Red States And Blue States Political Party Politics Of The United States United States World United States Map Red Map Blue Map National Endowment For The Humanities 2023 Summer Webimages Map Atlas 36a Recolor
Red Vs Blue States And The Shifting US Political Map In 2025 North Red Vs. Blue States How The U.S. Political Map Is Shifting In 2025 768x432 Result Of The US Election 2020 Animated Map Showing Red And Blue 1000 F 392857596 2026 Senate Election Forecast Maps 270toWin Consensus 2026 Senate ForecastRed Vs Blue The US Political Map Electoral Map United States Early General Colored Republican Red Democrat Blue Election 200970820
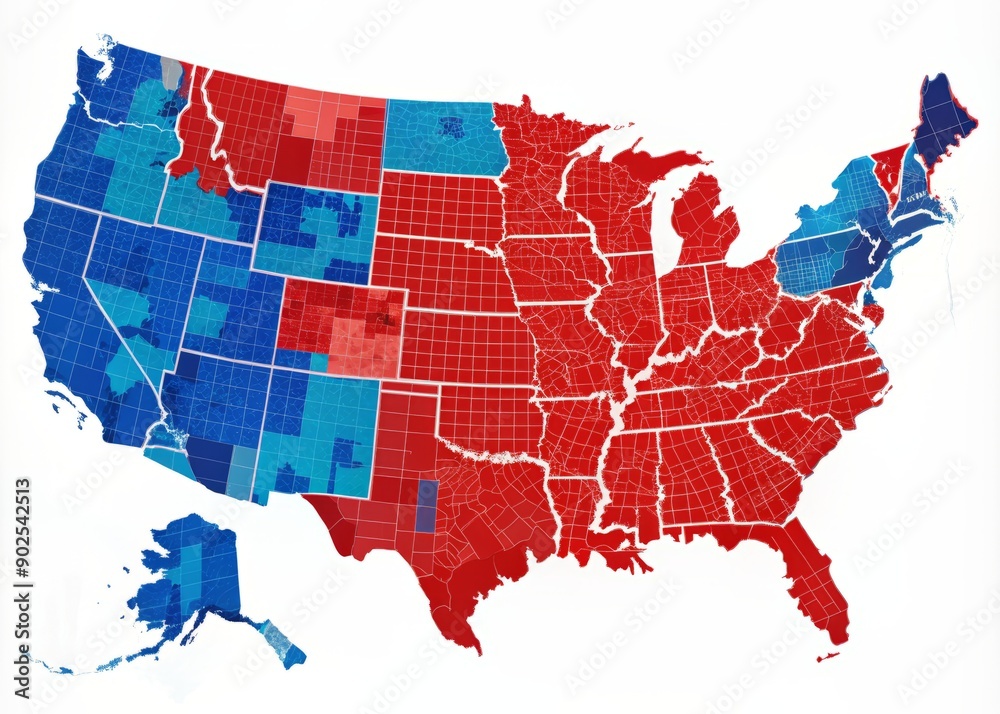
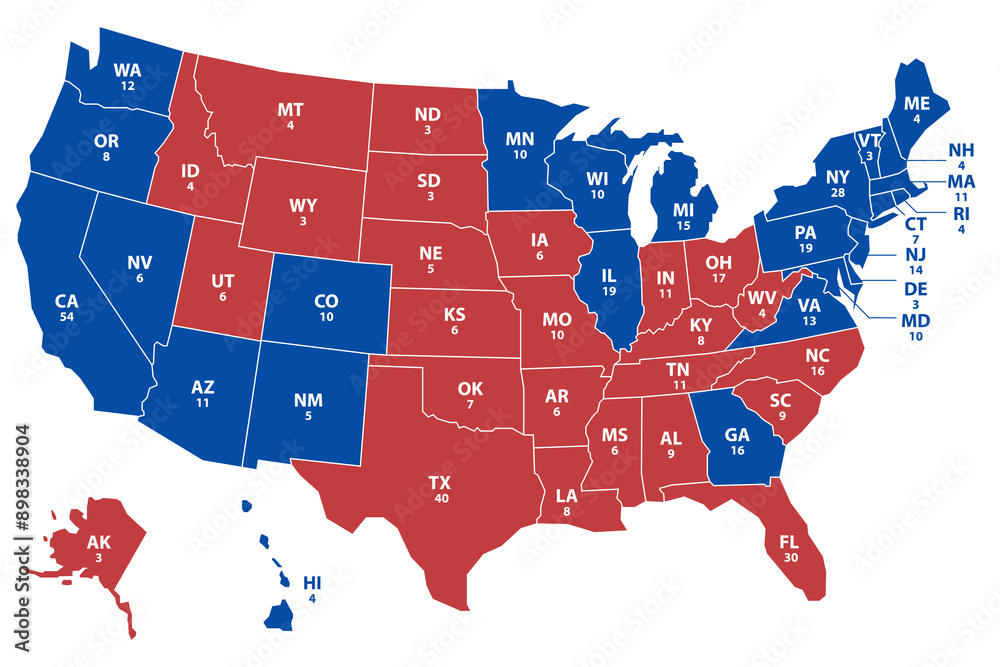
Red Vs Blue The US Political Map 2020 General Electoral Map Of 50 United States Colored In Republican Red Democrat Blue 2DAJB92 Red Vs Blue The US Political Map 1000 F 65100352 Colorful Electoral Map Of The United States Displays Election Results 1000 F 902542513 2024 Election Red And Blue States Map 1000 F 898338904
Premium Photo Divided States Of America Red And Blue Political Map Divided States America Red Blue Political Map 933065 1200 The End Of The Line For Red State Senate Democrats Sabato S Crystal Ball Map4 600 The Governors Part Two Familiar Dot 2026 Map But Watch Post LA 2023 Gov Party Control Map Shows Trump S 2024 Reelection Victory With Red And Blue Counties 600
Political Map Of Usa Red And Blue States 2024 Printable US Maps Red States And Blue States Wikipedia Political Map Of Usa Red And Blue States 2024 USA Map Of Red And Blue States 2025 2025 State Multistate Within Usa Map Of Red And Blue States 2025 Red Vs Blue States 2025 Where America Stands Now Red States Vs Blue States Today 300x179 Map Of Red States And Blue States 2016 Printable Map Ap Us Government And Politics American Political Culture Inside Map Of Red States And Blue States 2016