Unlocking the power of US Census Bureau maps provides an incredible resource for understanding the fabric of American society. These essential tools offer detailed insights into demographics, economics, and geography, crucial for researchers, businesses, and local governments across the United States. Exploring these maps helps users visualize population trends, housing statistics, and community characteristics with unparalleled precision. From basic demographic data to intricate geographic boundaries, the US Census Bureau maps serve as a cornerstone for informed decision-making. Discovering how to navigate these rich datasets can transform your understanding of local areas and broader national patterns, making them an indispensable asset for anyone analyzing the American landscape. They are vital for urban planning, market research, and academic studies, continually trending in informational searches.
What are US Census Bureau maps?
US Census Bureau maps provide visual representations of the extensive demographic, economic, and geographic data collected by the Bureau. These powerful tools help visualize population distribution, social characteristics, and economic patterns across the United States. They are invaluable for research, policy-making, and understanding community dynamics.
How do I access US Census Bureau maps?
You can access US Census Bureau maps primarily through their official website. Key platforms include data.census.gov for interactive data exploration, TIGERweb for geographic data browsing, and the Census Geocoder for specific address lookups. These resources offer various tools for viewing and downloading mapping information.
What types of data do US Census Bureau maps display?
US Census Bureau maps display a wide array of data, including population demographics like age, sex, race, and ethnicity. They also showcase economic indicators such as income and employment, housing characteristics, and detailed geographic boundaries from states to census blocks. This data helps analyze diverse aspects of American life.
Are the TIGER/Line files considered US Census Bureau maps?
Yes, TIGER/Line shapefiles are a fundamental component of US Census Bureau maps, providing the digital geographic base. These files contain boundary information for states, counties, census tracts, and roads. GIS professionals widely use TIGER/Line data to create their own custom maps and perform spatial analysis with Census data.
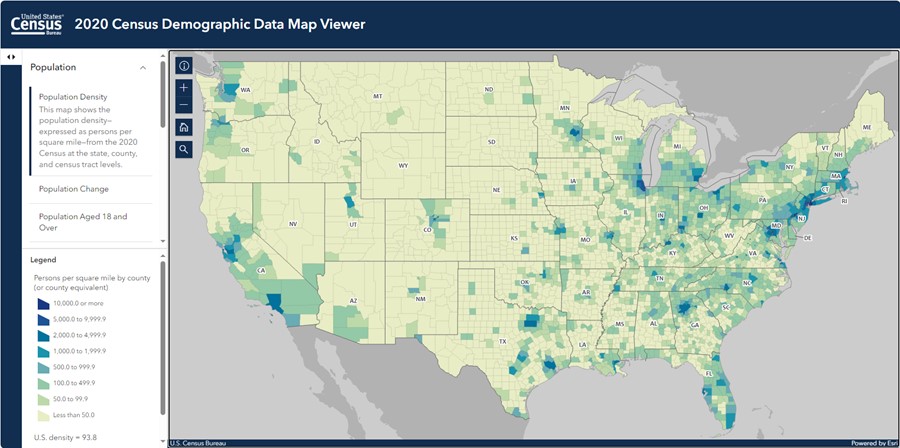
How are US Census Bureau maps used in urban planning?
Urban planners extensively use US Census Bureau maps to understand population density, identify areas needing specific services, and plan infrastructure development. The maps help visualize demographic shifts, housing needs, and economic disparities, informing decisions on zoning, transportation, and resource allocation within communities.
Are US Census Bureau maps updated regularly?
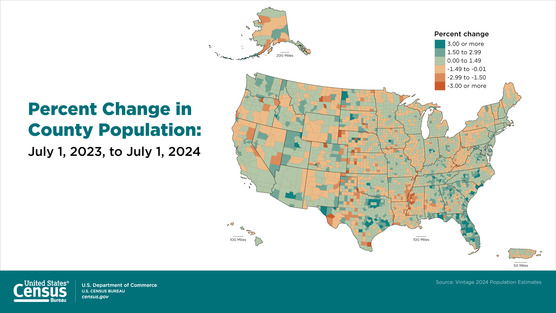
Yes, US Census Bureau maps are updated regularly, though the frequency varies by data type. Geographic boundaries through TIGER/Line files receive annual updates. Demographic and economic data from the American Community Survey (ACS) are released yearly, while the comprehensive Decennial Census data is updated every ten years.
The US Census Bureau maps are vital tools, providing a comprehensive visual understanding of America's demographic and economic landscape. They offer critical data on population, housing, business, and geography, empowering users to make informed decisions and analyze trends across the United States. These valuable resources are available to the public, updated regularly, and serve a wide array of informational and navigational purposes.
Navigating the World of US Census Bureau Maps
Understanding your community and the nation just got easier with US Census Bureau maps. These powerful resources translate complex statistical data into accessible visual formats. Whether you are a student, a business professional, or a curious citizen, these maps offer unparalleled insights into the American populace.
Exploring Demographic Insights with US Census Bureau Maps
Delve deep into the population characteristics of any US region using these dynamic maps. You can easily visualize age distributions, racial and ethnic compositions, and educational attainment levels. This wealth of information supports diverse studies and local planning efforts, providing a clear picture of who lives where.
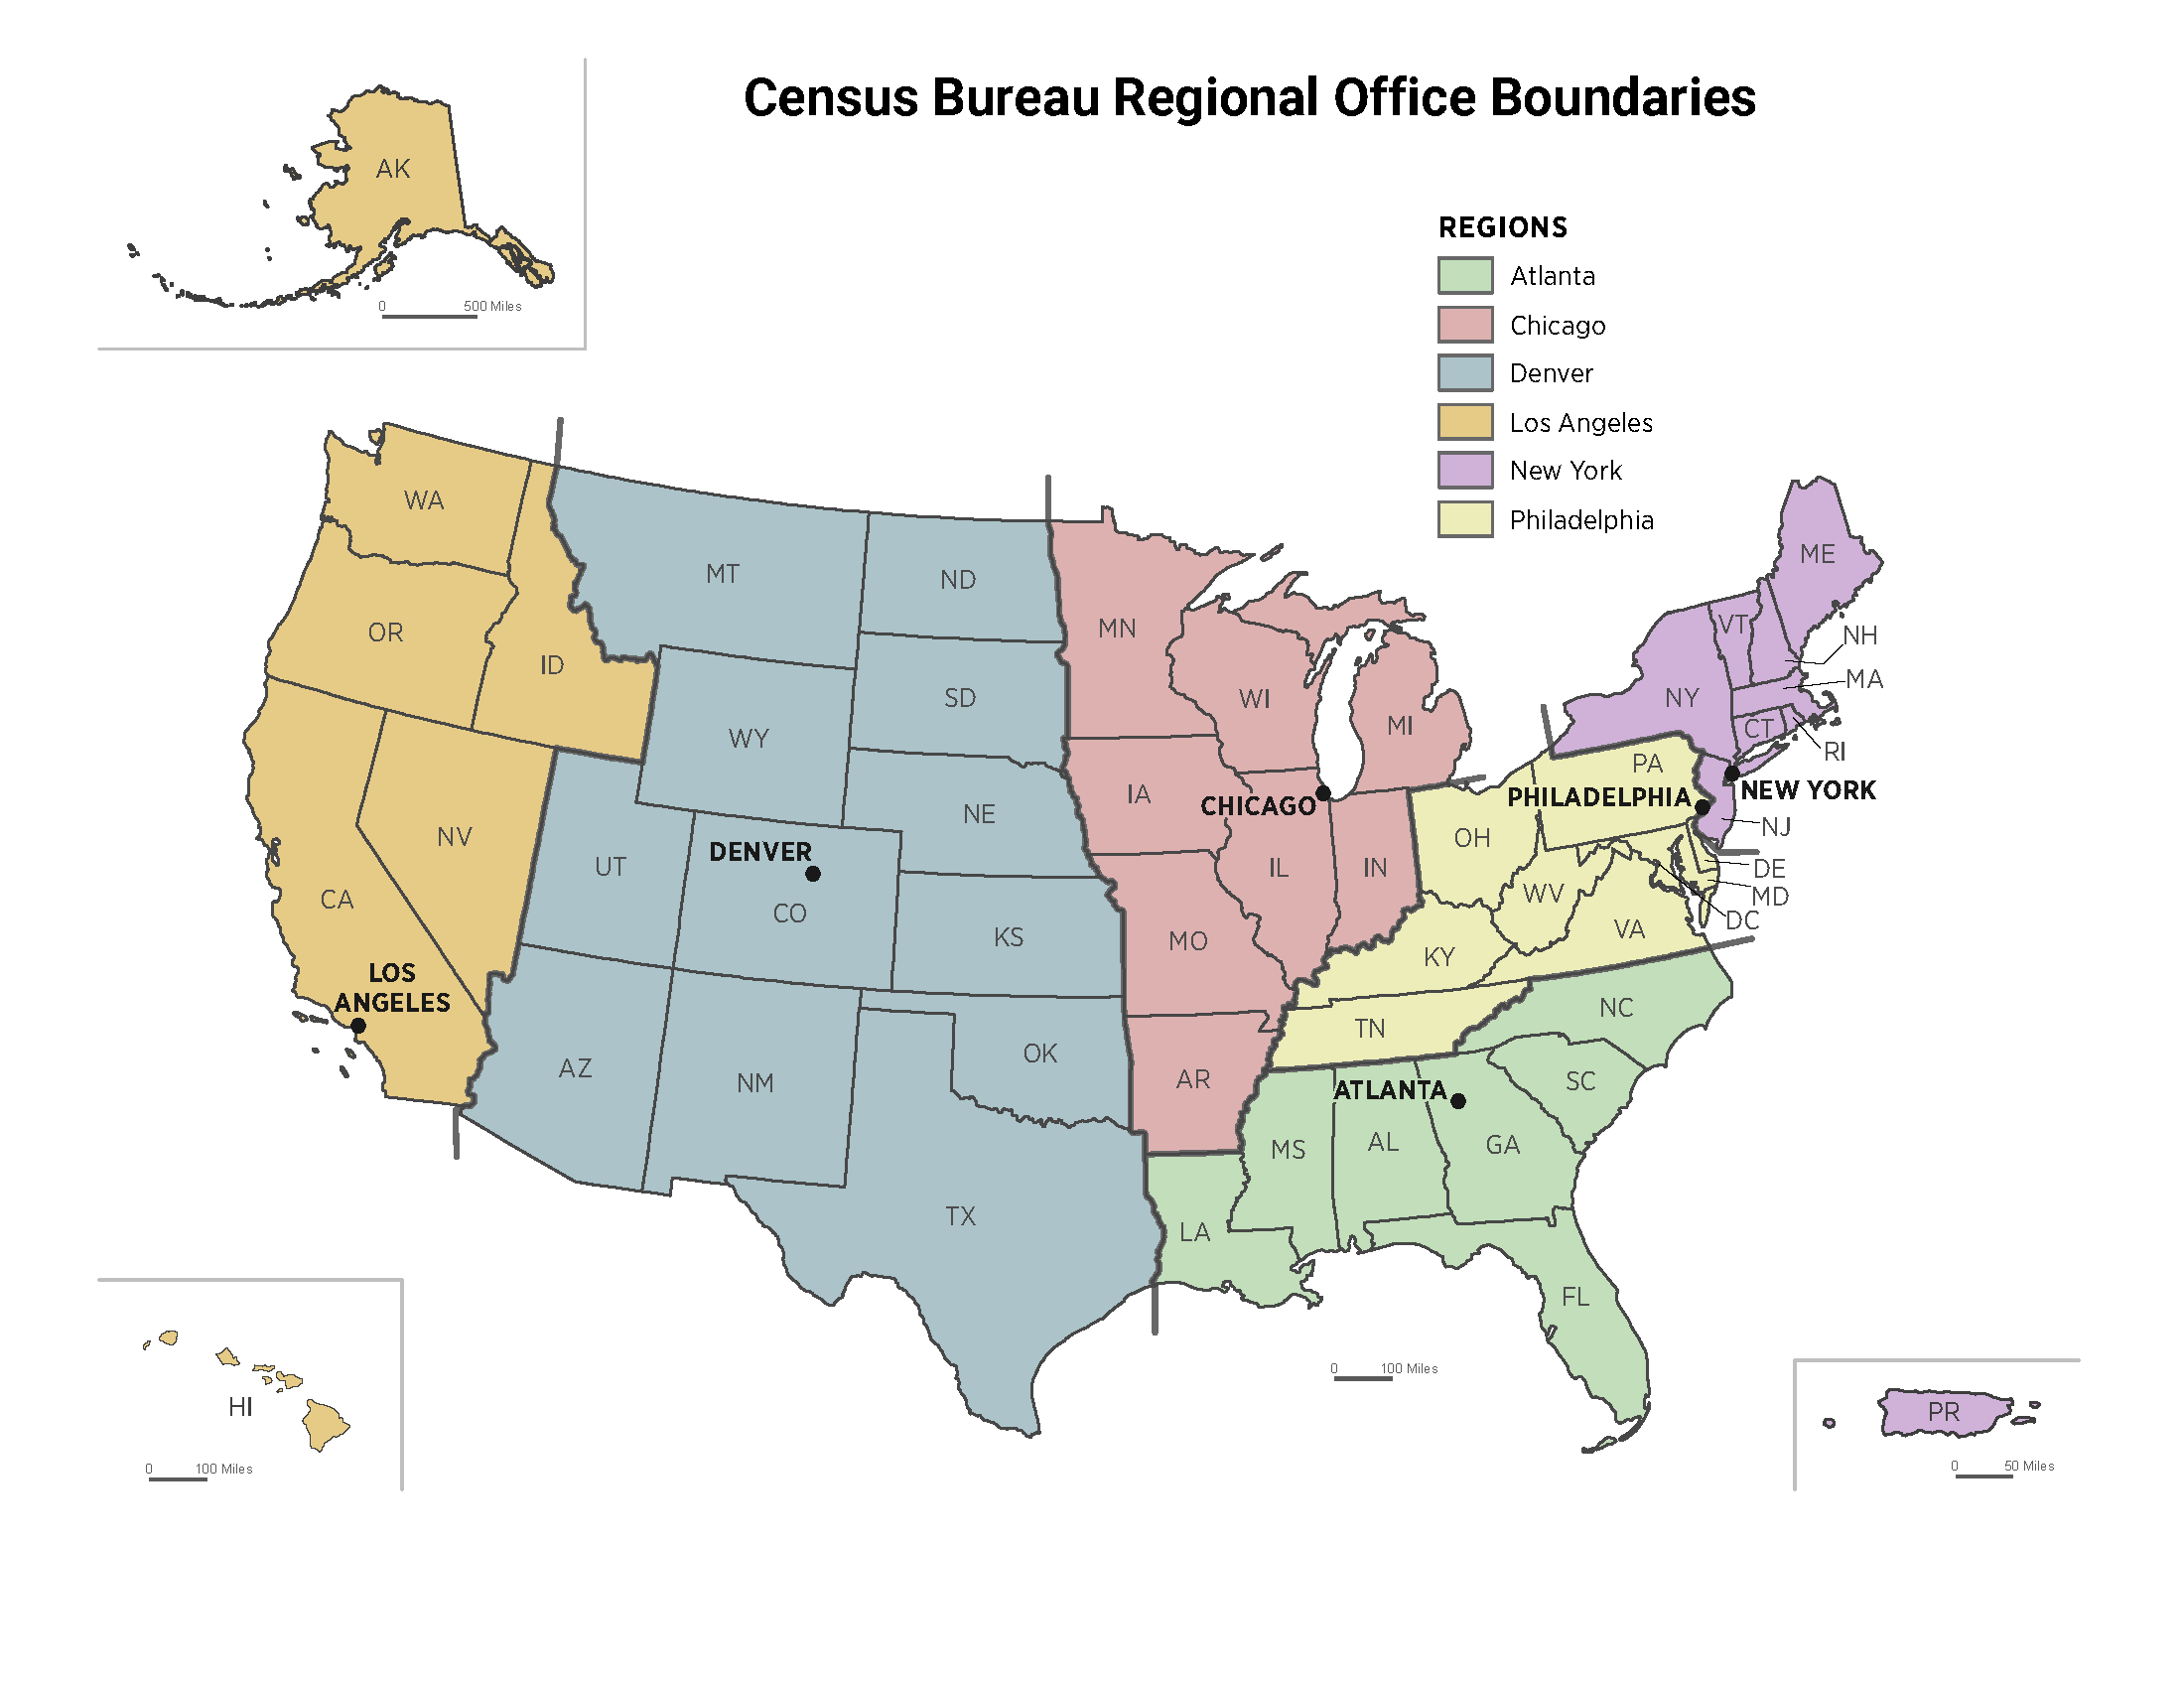
Geographic Data and Boundaries: The Foundation of US Census Bureau Maps
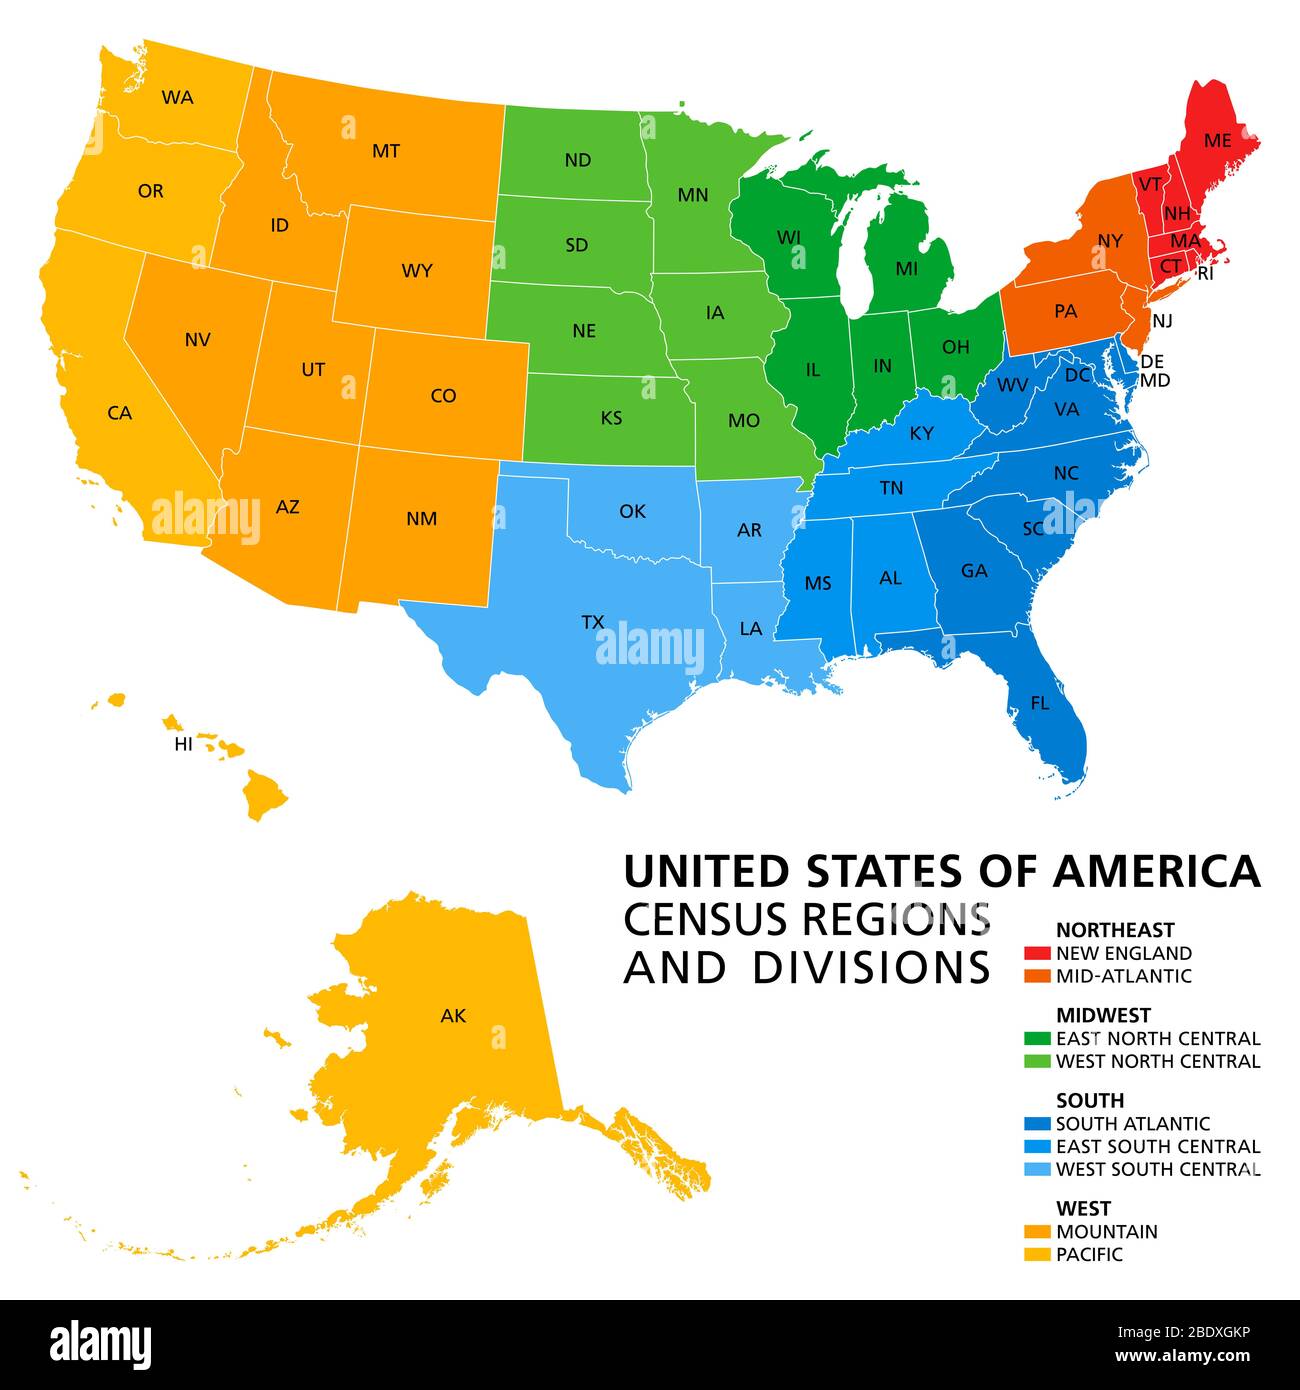
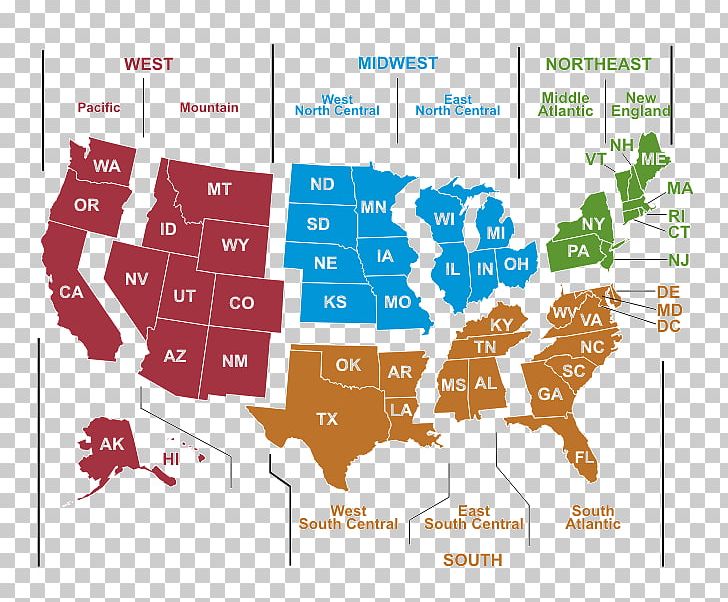
The US Census Bureau also provides intricate geographic data, including boundaries for states, counties, census tracts, and blocks. These precise geographic references are fundamental for accurate data analysis. They help users understand the spatial distribution of various attributes, critical for urban development and resource allocation.
How Businesses Leverage US Census Bureau Maps for Growth
Businesses in the United States harness these maps for market research and strategic planning. They identify potential customer bases, analyze economic indicators, and pinpoint optimal locations for expansion. The detailed insights from US Census Bureau maps can significantly boost business intelligence and competitive advantage.
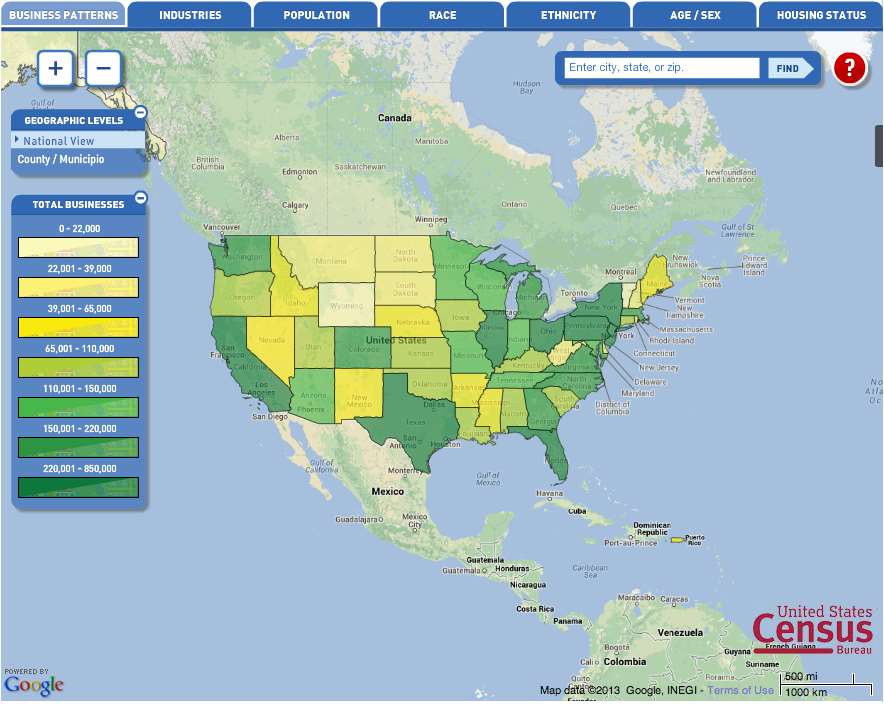
The Power of Interactive US Census Bureau Maps Online
The Bureau's online platforms offer interactive mapping tools that make data exploration intuitive. Users can customize views, layer different data sets, and download information for further analysis. These digital tools ensure that critical data about the US population is readily available and highly usable for everyone.
| Data Type | Description | Availability |
| Population Demographics | Age, sex, race, ethnicity, household type | Annual, Decennial Census |
| Economic Characteristics | Income, poverty, employment, industry | Annual (ACS), Economic Census (5 years) |
| Housing Data | Housing units, occupancy, value, rent | Annual (ACS), Decennial Census |
| Geographic Boundaries | States, counties, tracts, blocks, ZCTAs | Ongoing updates (TIGER) |
| Migration Patterns | Domestic and international movement | Annual (ACS) |
What Others Are Asking?
What is the primary purpose of US Census Bureau maps?
US Census Bureau maps visually represent demographic, economic, and geographic data collected by the Bureau. They help users understand population distribution, social characteristics, and economic patterns across the United States, aiding in policy-making, research, and resource allocation. These maps make complex data accessible and understandable for a broad audience.
How can I access US Census Bureau maps online?
You can access US Census Bureau maps through their official website, primarily via tools like the Census Geocoder, TIGERweb, and the data visualization platforms like data.census.gov. These platforms offer interactive maps, downloadable shapefiles, and various mapping applications to explore demographic and economic data for different US regions.
Are US Census Bureau maps free to use?
Yes, all data and maps provided by the US Census Bureau are publicly available and free to use. As a federal agency, the Census Bureau makes its information accessible to support public understanding, research, and governmental functions. Users can download, view, and analyze these valuable resources without cost.
What kind of geographic data is available through US Census Bureau maps?
US Census Bureau maps offer extensive geographic data, including boundaries for states, counties, census tracts, block groups, and individual blocks. They also provide information on urban areas, tribal lands, and voting districts. This detailed geographic framework is crucial for accurate spatial analysis and data interpretation across the United States.
How often are US Census Bureau maps updated?
The frequency of updates for US Census Bureau maps varies by data type. Geographic boundaries, such as those in the TIGER/Line files, are updated annually. Demographic and economic data derived from the American Community Survey (ACS) are released yearly, while comprehensive decennial census data is updated every ten years, providing fresh insights.
FAQ about US Census Bureau Maps
What are US Census Bureau maps?
US Census Bureau maps are visual representations of demographic, economic, and geographic data collected by the US Census Bureau. They help illustrate population distribution, social trends, and economic indicators across the United States, making complex information digestible for various users.
Who uses US Census Bureau maps?
Researchers, policymakers, businesses, urban planners, educators, and the general public in the United States use these maps. They provide essential data for making informed decisions, conducting academic studies, planning public services, and understanding community characteristics.
Why are US Census Bureau maps important?
These maps are crucial for understanding the nation's changing demographics, economy, and geography. They support equitable resource allocation, guide political representation, facilitate market analysis, and inform urban development, ensuring data-driven decisions across the United States.
How do US Census Bureau maps help with planning?
US Census Bureau maps assist planning by visualizing population density, infrastructure needs, and socio-economic disparities. Urban planners use them for zoning, transportation, and public services, while businesses leverage them for market segmentation and site selection, leading to more effective strategies.
Accessing demographic and economic data through interactive maps. Understanding geographic boundaries like counties and census tracts. Utilizing TIGER/Line shapefiles for GIS analysis. Exploring data visualization tools for community insights. Finding free and publicly available government data.
34


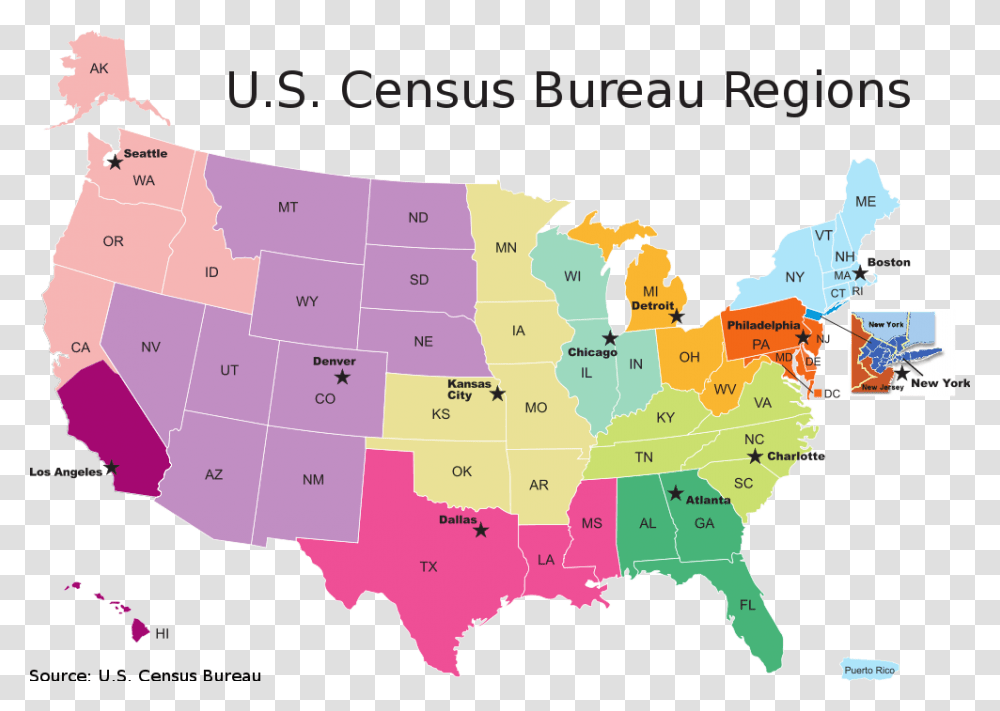
US Census Bureau Selects Texas For Its 2026 Census Test Texas Census 2026CT National Sites Map Large Scaled . Regional Offices New Ro Map . Census Bureau Announces Sites For 2026 Census Test Feature 2026 Census Test Sites . 2026 Census Test Census Logo Sharing Card . TL 8 Batteries Page 5 Citizens Of The Imperium Us Population Density 2021

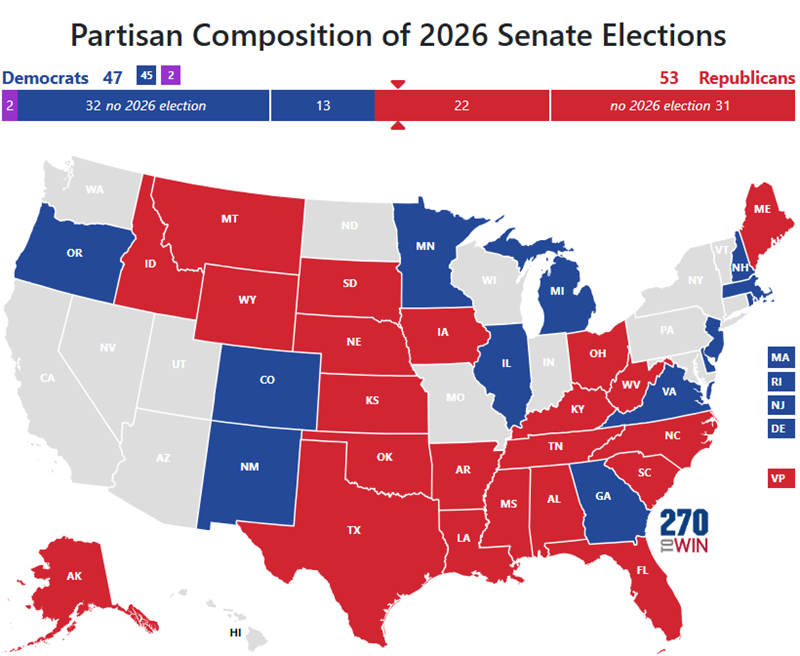
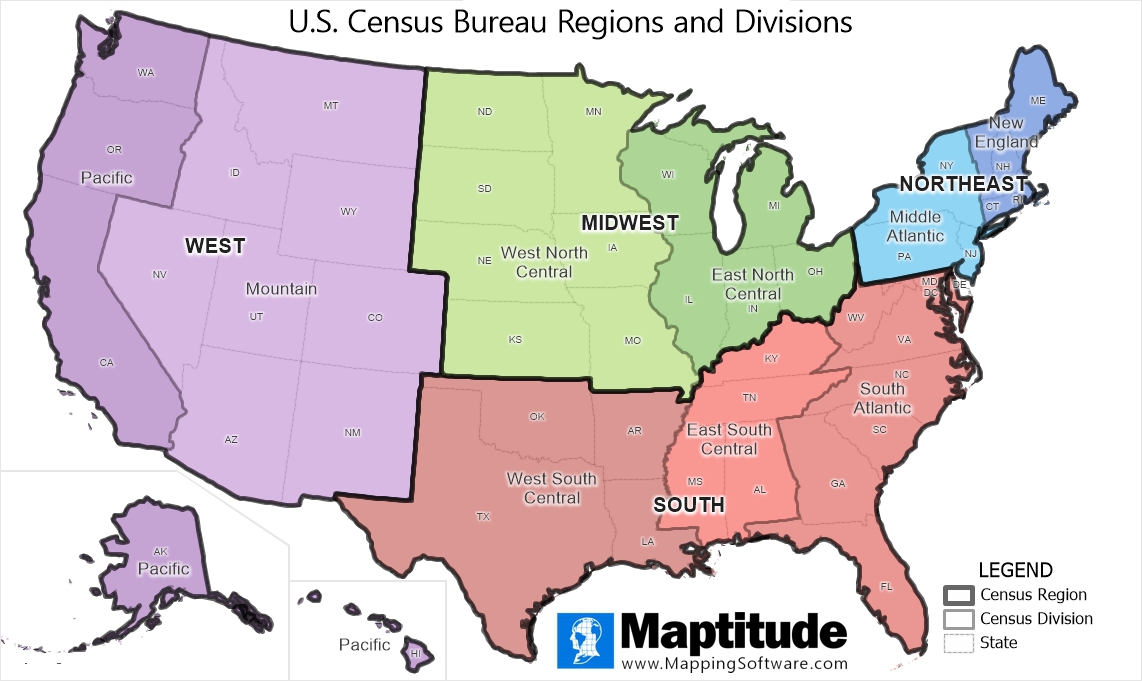
Census How To Pass The GED 2020 Map02 . Introducing The 2026 Senate Interactive Map 270toWin Senate Incumbent . More Lies Data Us Census Bureau Map Diagram Plot Atlas Transparent More Lies Data Us Census Bureau Map Diagram Plot Atlas Transparent Png 1547349 . Maptitude Map Census Regions And Divisions Xmaptitude Census Region Division Map . Northeast United States Map Hi Res Stock Photography And Images Alamy United States Census Regions And Divisions Political Map Region Definition Widely Used For Data Collection And Analysis 2BDXGKP


US Census Bureau Picks Google Maps For Data ITnews US Census Data On Google Maps . Introducing The 2026 Senate Interactive Map 270toWin Preliminary 2026 Senate Outlook . The US Census Bureau Thread Page 182 Forum US Population Density Change . Census Bureau Planetizen Courses Census Data Urban Planning . File US Population Map Png Wikimedia Commons US Population Map


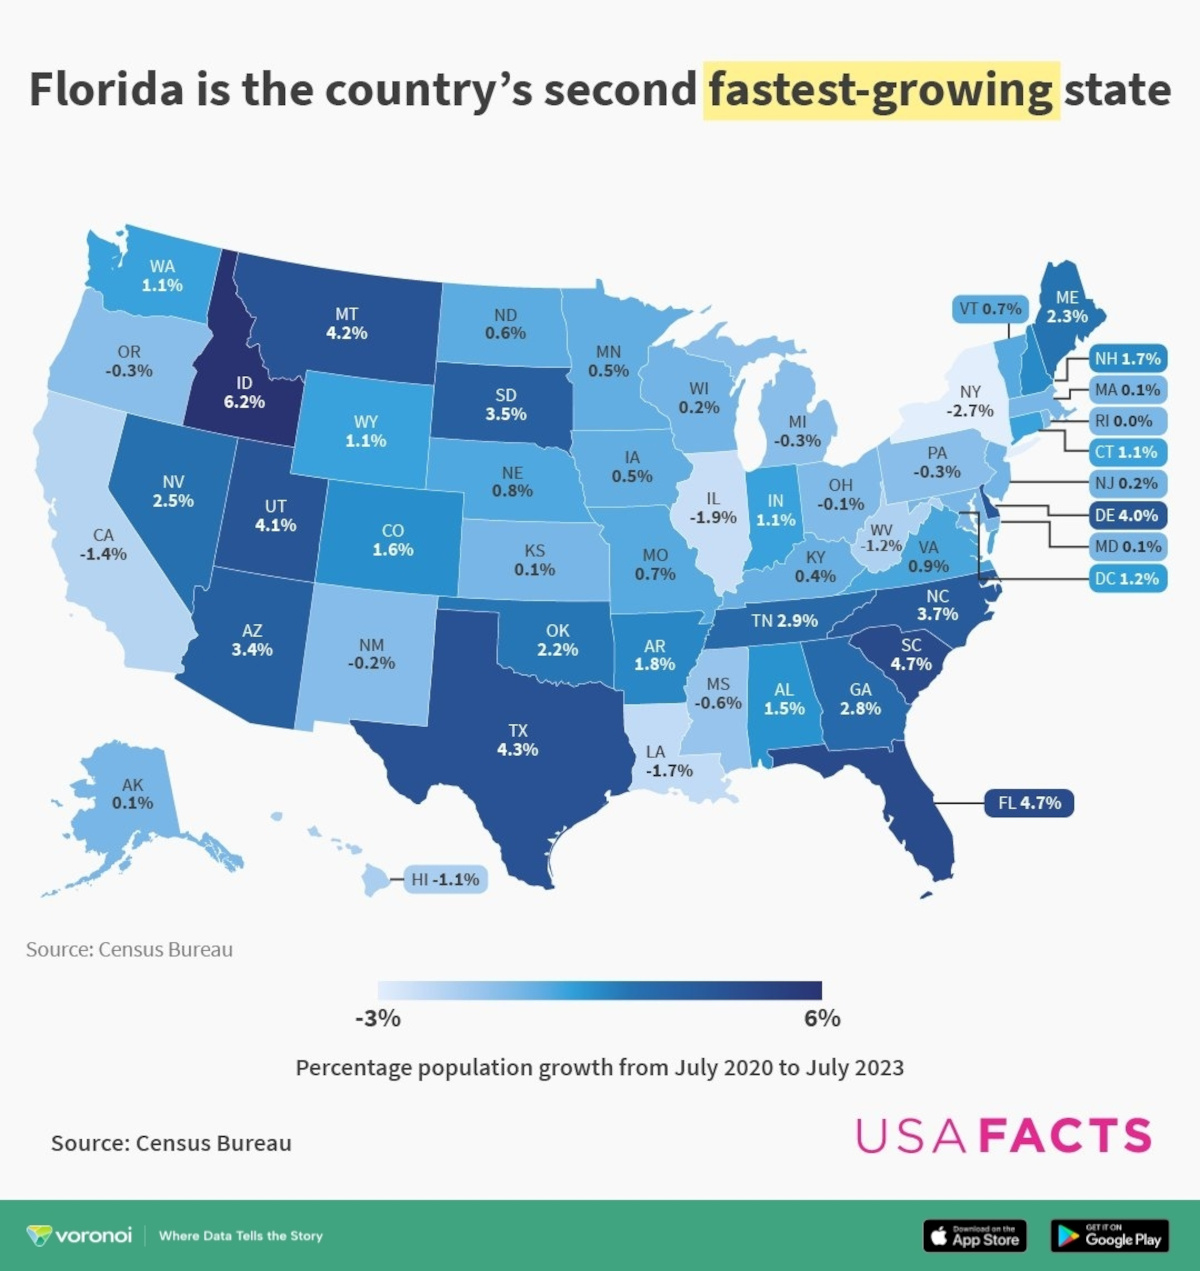
Fed Soothes As Trump Seethes TradingView News Tag Newsml L8N3Q30VJ Resized . US Census Regions Your Ultimate Guide 1 A Map Of The United States With The US Census Bureau Regions And Divisions That I . Impact Of Latest Population Estimates On 2030 The CP 1024x786 . US Census Regions Your Ultimate Guide U.S. Census Bureau Regions.svg. Population Map Of Florida Fastest Growing State Populations
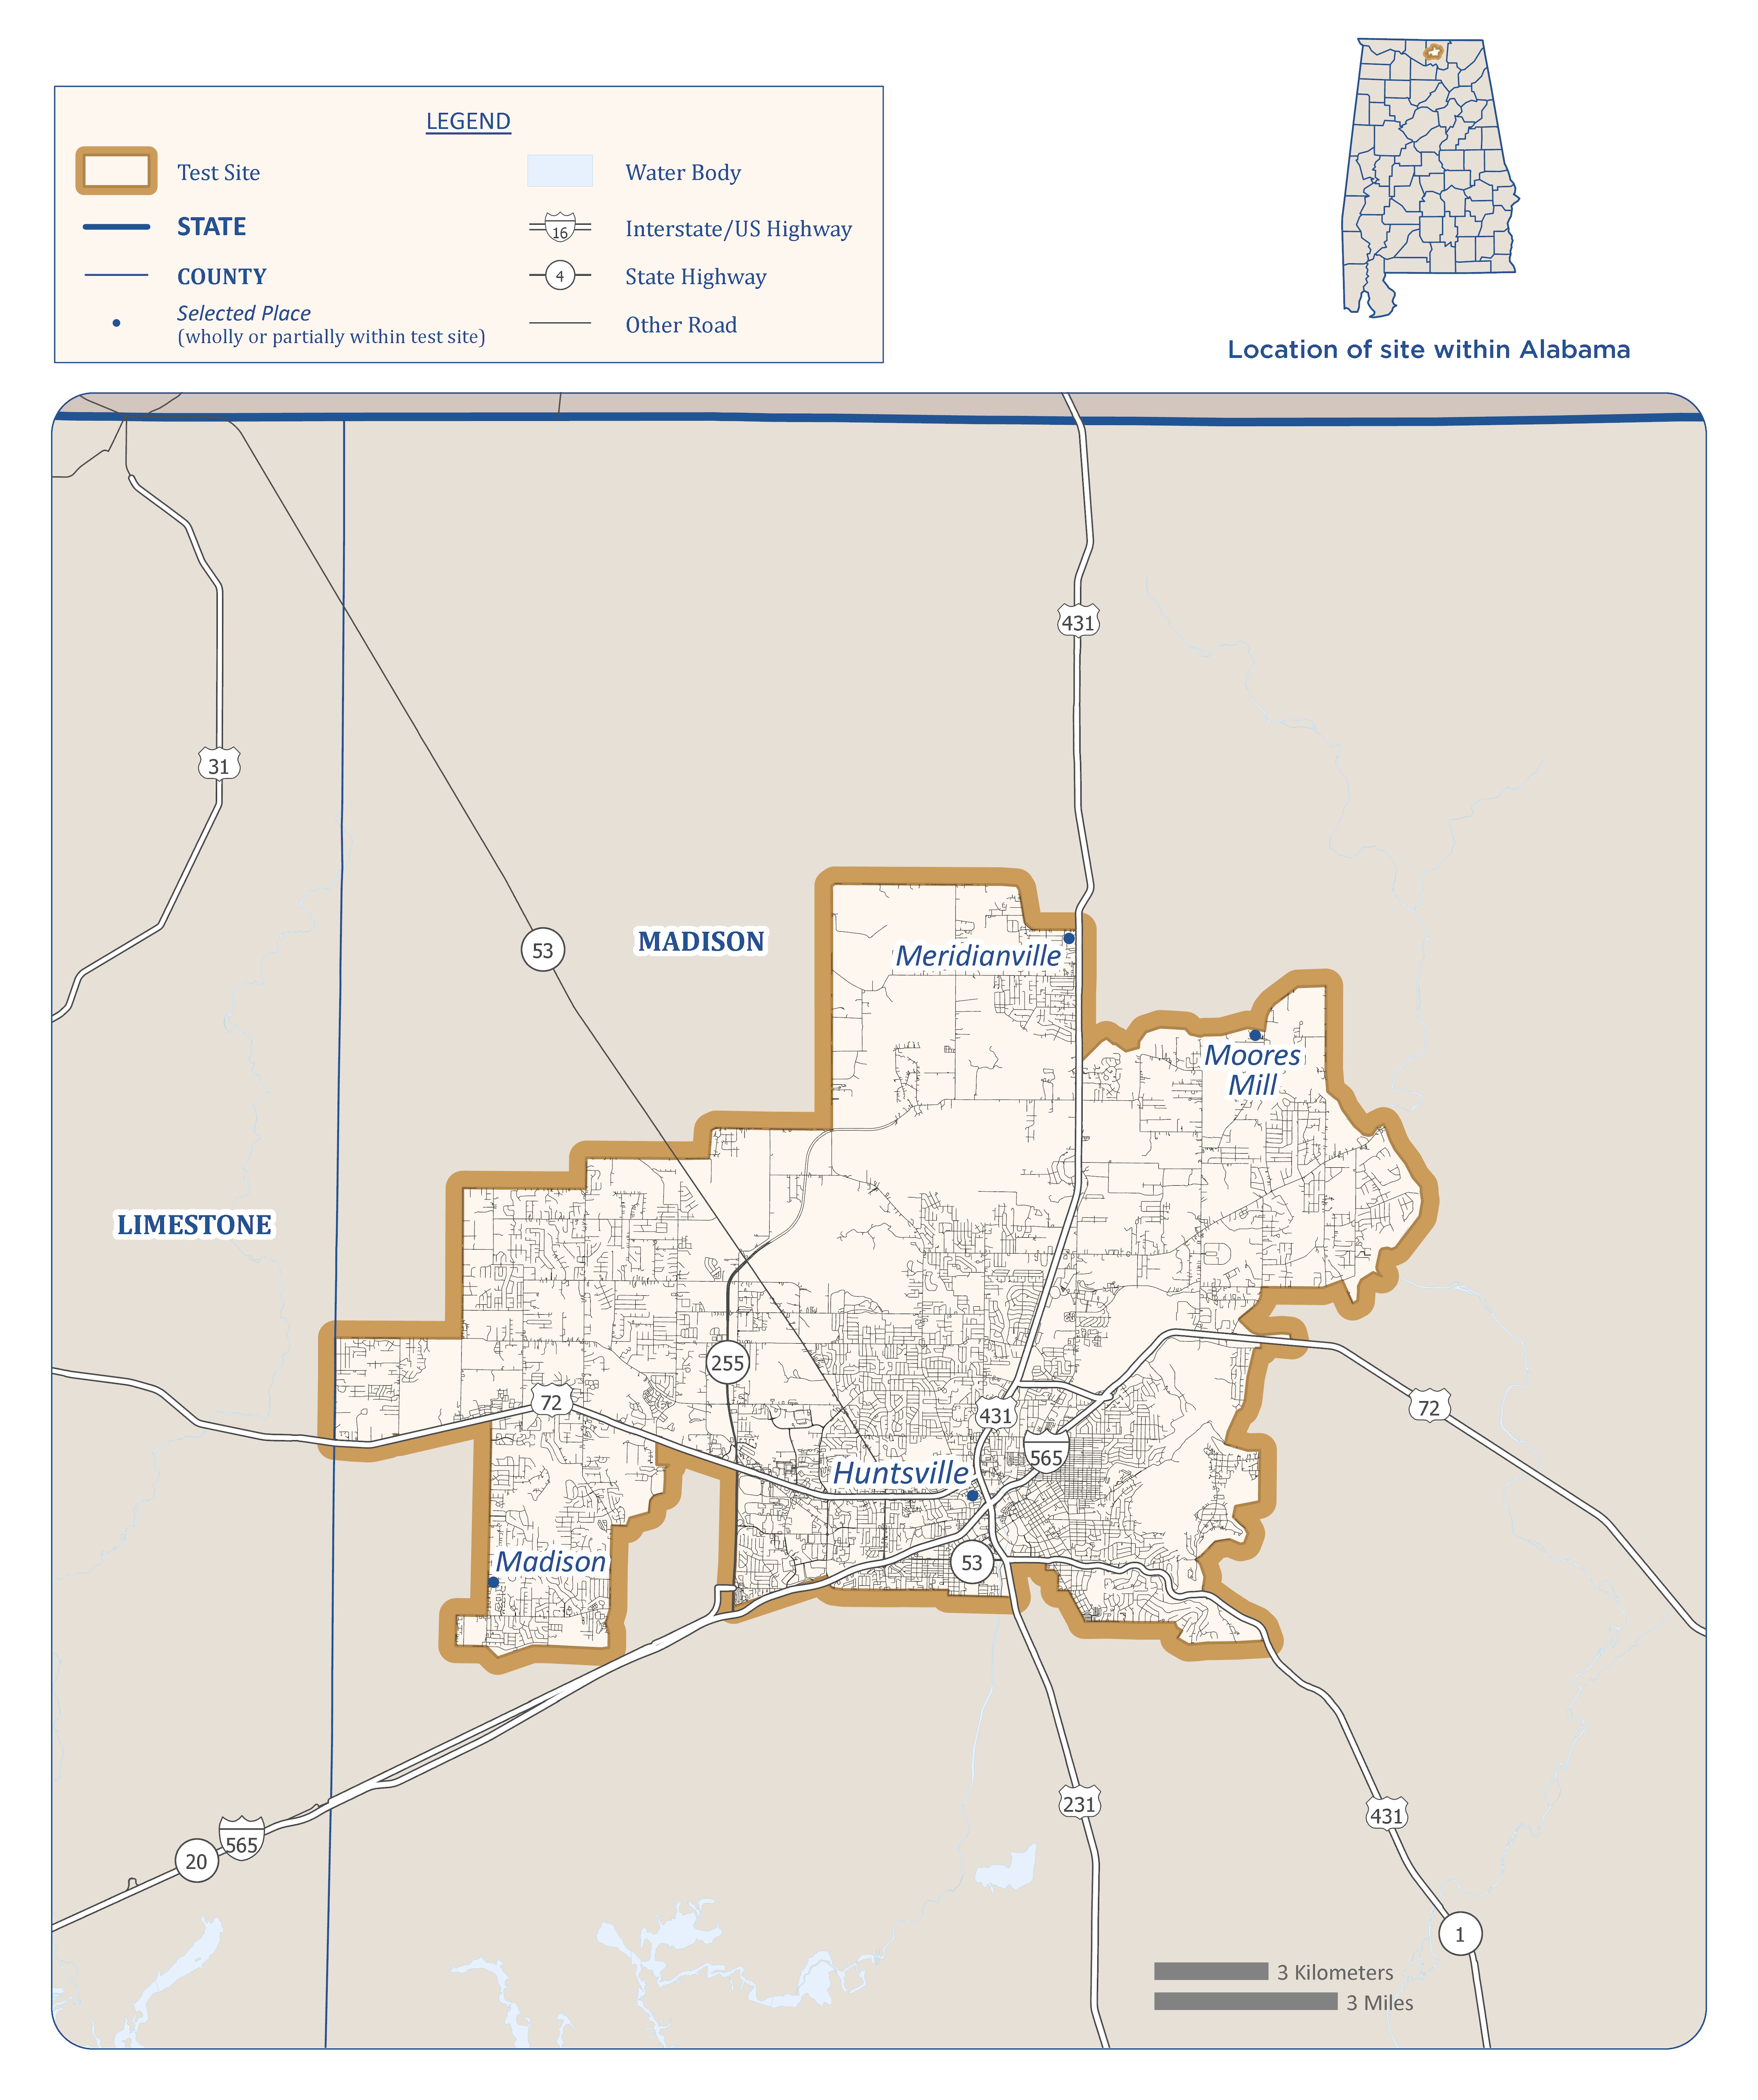


2020 Census Demographic And Housing File DHC . 2026 Census Test Press Kit 2026CT Huntsville Al . Census Main Slider Image . 2026 Census Test Where We Are Testing And Why 2026 Census Test Where And Why . 2026 Census Test Sites Summary Of Sites Selected By Criteria 2026 Census Test Site Selection Criteria


U S Census Regions And Divisions Of The U S Retrieved From U S US Census Regions And Divisions Of The US Retrieved From US Census Bureau . Census Bureau Announces Sites For 2026 Census Test Black Wht Logo . United States Of America United States Census Bureau Region Geography Imgbin United States Of America United States Census Bureau Region Geography Map Map . AES FAQs USCENSUS IDENTITY SOLO BLACK 1.5in R No Padding.svg. US Census Bureau Selects Texas For Its 2026 Census Test Texas Census 2026 Test Site Criteria


Census Blunder May Tip 2024 To Democrats 2020 Map03 . Census Bureau Jobs Available For The 2026 Census Test 2026 Census Test Hiring 2 Crop . When Are The 2026 Elections . Census Data